Tabular
|
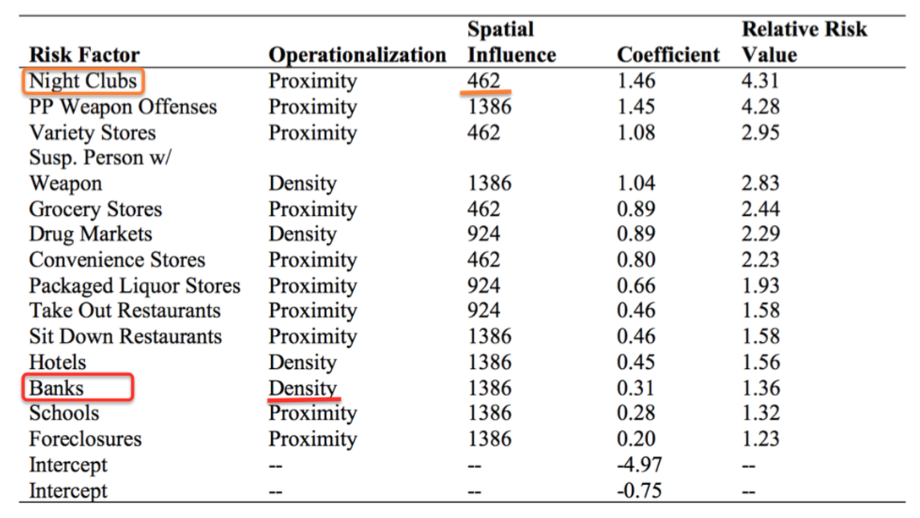
Left: RTM results table for Robbery in Kansas City, MO.
There is a lot of information and insights that can be gleaned from the RTM results table. It communicates not only what factors are significant attractors of robbery but also which ones are not particularly important (by their omission). This can inform decisions to stop paying attention to factors that were once thought to be important, such as parks, and focus attention on the spatial factors that truly correlate with criminal behavior, but might have been overlooked, such as grocery stores. |
You can also learn how model factors influence behavior and the extent of this spatial influence. E.g., We might have assumed (through intuition) that bank locations relate to robbery incidents. But it’s not proximity to banks themselves that heightens risk, it's areas with high concentrations of banks that attract robbery incidents and, therefore, pose the risk of robbery. Nightclubs might be given the highest priority for intervention activities since they are at the top of the list with the highest RRV. But, from the RTM output, we know to focus attention to within the immediate block of nightclub facilities, as opposed to farther away.
Comparing RRVs across model factors is useful for prioritizing risky features and for speculating why some features may pose exceptionally high risks compared to others. For instance, drug markets may be high-risk due to the availability of large quantities of cash carried by buyers or dealers who would not seek assistance from the police. Foreclosures may be high-risk due to the absence of invested caretakers who would otherwise serve as “eyes and ears” within the area. Drug markets within 1,386 feet of a foreclosed property may present even greater risk. And so forth. If these mechanisms through which drug markets or foreclosures influences illegal behavior and poses risks of robbery is considered legitimate, then mitigation efforts can be developed and implemented accordingly. A similar problem-oriented process of risk mitigation can be had for each risk factor, with priority given to factors that have the highest relative risk values. Once risk factors are identified, stakeholders can explore the (likely) mechanisms through which risks are presented and then initiate mitigation efforts. [Can you think of what you might do to address one of these factors? Be creative! Use this worksheet to guide the process.]
Comparing RRVs across model factors is useful for prioritizing risky features and for speculating why some features may pose exceptionally high risks compared to others. For instance, drug markets may be high-risk due to the availability of large quantities of cash carried by buyers or dealers who would not seek assistance from the police. Foreclosures may be high-risk due to the absence of invested caretakers who would otherwise serve as “eyes and ears” within the area. Drug markets within 1,386 feet of a foreclosed property may present even greater risk. And so forth. If these mechanisms through which drug markets or foreclosures influences illegal behavior and poses risks of robbery is considered legitimate, then mitigation efforts can be developed and implemented accordingly. A similar problem-oriented process of risk mitigation can be had for each risk factor, with priority given to factors that have the highest relative risk values. Once risk factors are identified, stakeholders can explore the (likely) mechanisms through which risks are presented and then initiate mitigation efforts. [Can you think of what you might do to address one of these factors? Be creative! Use this worksheet to guide the process.]
Cartographic
There are few limits as to the visual communication potential of risk terrain maps and related spatial data; Far too many options to discuss here.
|
By viewing a risk terrain map in a GIS you can adjust the symbologyand design final map layouts to visually communicate spatial vulnerabilities of a jurisdiction. Raster maps at the micro level can be created and presented as images in reports.
This grayscale map (above) shows locations that are two standard deviations above the mean Relative Risk Score symbolized in black. According to this categorization, they are considered the highest risk places for robbery in Kansas City. The likelihood of crimes occurring at these places is more than 40 times greater than at some other locations. |
Cells within a raster map can also be aggregated up via spatial joins to street segments, police beats, census tracts and so on. Maps can even be exported as KML files and layered in Google Earth.
The two maps (above) show the micro-level places and police beats, respectively, that are high risk for Battery/Assault/Ambush against Chicago Police Officers. |

