
|
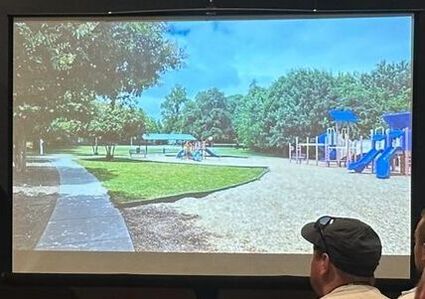
The practical applications of Risk Terrain Modeling (RTM) for policing, crime prevention, and public safety demonstrated through professional presentations at the IACA conference in Grapevine, Texas were engaging and inspiring. Here are 3 notable examples that can be replicated elsewhere. Durham, NC For decades that playground (slide in left pic) didn’t have kids playing in it because it was a chronic crime hot spot. Longtime Durham Police Department (DPD) officers described it as being that way since they were new recruits… and never thought it could change, until now.
Crime Analyst Lauren Kingsbury discussed how DPD uses RTM for crime prevention and Risk-Based Policing (RBP). The DPD pilot study focused on places, not people: Each PD District got RTM analyses for the unique crime patterns within them. Then police and other city partners coordinated their strategy for target/control areas, treatments, dosage, and success measures for evaluation. It worked! “It is something we are going to continue doing,” Kingsbury explained. With (RTM): “We have seen a reduction in many issues and could not have made the progress we have seen without the partnerships we have formed." — District 1 Lieutenant Kansas City, MO The city began with Risk-Based Policing and now does Data-Informed Community Engagement (DICE). They start with Risk Terrain Modeling (RTM), then use results to partner w/ local stakeholders who do what they do best at the places needing them most. Captain Jonas Baughman from the Kansas City Police Department presented on behalf of the city to show how it's as easy as 1-2-3! Read more about the Mayor's DICE Taskforce at kcur.org Dallas, TX The Child Poverty Action Lab (CPAL), a nonprofit organization, leads Data-Informed Community Engagement (DICE) in Dallas. Alan Cohen and Rachel Tache discussed how Risk Terrain Modeling (RTM) is “radically pragmatic” for crime prevention with DICE. With DICE they don’t use data to “admire the problem.” But “to drive action.” To “empower community members” to co-produce public safety. They focus on the highest-risk micro places in each police division, covering about 0.003% of the city’s land area, and coordinate multiple stakeholders in low-cost activities using existing local resources to make spaces safer. Impacts were immediate and sustainable, with a 68% drop in summertime gun violence… and an 8-block diffusion of benefits! Check out the before and after pictures!
Knowledge of high-risk places can improve officer safety in the line-of-duty when incorporated into dispatch and calls-for-service (CFS) response procedures.
Assessment and management of risk are operational imperatives for police officers. Although the goal of many police agencies has been to be the ever-present “capable guardians,” a police officer’s presence can also become a new target of aggression and violence, making the police officer the potential victim. Officers assess their risk of physical injury in every call for service. They are beholden to deal with criminal behaviors and hazardous situations for others while simultaneously mitigating their own potential for harm. To that specific end, police responses to CFS must be careful – given the known facts and conditions of the situation and location. In such a scenario, assessment of spatial risks is critical. Risk terrain modeling (RTM) analysis identifies features of the landscape that create potentially dangerous settings and situational contexts. Intel from RTM allows officers to more adequately prepare for CFS and respond accordingly to any address (relative to all others) throughout their jurisdiction. Adequate preparedness for CFS at high-risk places does not require more aggressive stances due to heightened awareness; but rather, could include policies that afford smarter dispatch protocols and tactical deployments of resources to reduce the likelihood of violence and injury for everyone involved. For instance, a trespassing call originating in a high-risk location for shootings could be similarly as dangerous as a report of a robbery-in-progress at a location that's low-risk for shootings. Research published in the international journal Policing demonstrated how RTM articulates high-risk places for assaults against police officers. Notably, incidents of assault with a firearm (N=76) and assault resulting in serious injury (N=26) did not cluster. This means that assaults and related injuries to police officers occurred time-and-again at what appeared to be random locations. The question answered with RTM was: “do these incidents share common spatial features of the landscape where they occur?” Yes, they did. In fact, some micro-level places had over 70% greater likelihood of injuries to police officers compared to other areas. A policy brief published by the Rutgers Center on Public Security examines spatial and situational risk factors for various types of felonious assault and mortality to police officers. It demonstrates how spatial factors diagnosed by RTM could be made actionable through risk narratives that offer a better level of situational awareness at call for service settings. For example, arterial and collector roadways, absence of median dividers, and covered roadways are spatial factors that increase the risk of violent assaults to officers during traffic stops. Spatial risk factors for injury during foot pursuit include nearby large unlocked buildings, abandoned lots, uneven terrain, tall brush, residential yards, walls, fences, swimming pools, clotheslines (backyards), sharp turns, and wide open spaces. To mitigate risk, spatial intel from RTM can be used tactically to allocate resources or direct operations when responding to CFS at the highest-risk places within a jurisdiction. Here’s how that could happen:
For example, a normally ‘low-risk’ call type such as “trespassing” that has a response address located in a high-risk area gets the protocol applied (e.g., perhaps two officers are automatically dispatched instead of one; maybe they coordinate their response directions en route to gain multiple visual perspectives upon arrival). Knowledge about risky places can be used by police and communications professionals to assess and manage personal injury risks at micro places throughout a patrol area. Real-time assessments within a jurisdiction can be routinely made on a call-by-call basis, thereby assessing relative risks to optimize resources and reduce ‘alert fatigue’. In this way, RTM can help police officers better anticipate their risk terrains and respond accordingly to improve personal safety. It also empowers dispatchers with new insights to help them direct safer encounters between police and the constituents they serve. Associate Attorney General Vanita Gupta gave an impassioned shout-out to Rutgers University and the Newark Public Safety Collaborative (NPSC) during opening remarks of the U.S. Department of Justice OJP ‘Community Violence Intervention & Prevention Initiative’ national conference in St. Louis. Watch the clip (at 32:45 - 33:30 minutes) and the entire opening ceremony via https://www.justice.gov/opa/video/community-violence-intervention-prevention-initiative-grantee-convening-opening-ceremony Last year, our Bureau of Justice Assistance funded a new effort called "Reimagining Justice," a phrase that captures exactly what we're trying to achieve. Through a grant to the Newark Public Safety Collaborative, based out of Rutgers University, we are supporting an effort to test new community safety strategies that complement traditional enforcement measures. The mission is to put data and research into the hands of community stakeholders so they can be part of the design and development of community safety solutions.  The "Enhancing Procedural-Justness of Encounters Through Substantiation" (EPJETS) project, funded by NIJ and led by Dr. Nusret Sahin at Stockton University, focuses on improving police-community relations by increasing transparency and accountability during traffic stops.
To achieve this goal, EPJETS incorporates risk terrain modeling (RTM) to identify and map local areas of a community that are at high risk for traffic crashes and related injuries. This directs resources and informs conversations during police-community interactions. This use of RTM is another example of data-informed community engagement (DICE), whereby data analytics steer community-focused programs and create more effective and equitable public safety. It improves procedural justice. By engaging with people in the community and setting expectations based on local problems and related data sharing, police can build trust and strengthen community relations while also enforcing the law. Each month the National Institute of Justice (NIJ) features a term from its scientific research portfolios informing significant American justice system issues and solutions.
Risk Terrain Modeling (RTM) is the term for January 2023! Check it out at nij.ojp.gov/term-month Are you ready for the holiday shopping (crime) season? Crime patterns change, and the time-of-day or day-of-week makes risky places even more fluid. Holiday shopping can make crime patterns more dynamic. Different crime types such as robbery, burglary or motor vehicle theft have their own unique seasonal trends and spatial patterns. Even traffic crashes might begin to cluster in locations that differ from the hot spots experienced earlier this year.
The National Insurance Crime Bureau (NICB) warned of an increased risk of crime across the United States this holiday season which is likely to strain already-stretched police resources. Police in California created a retail crime task force, and other jurisdictions are responding similarly. Data analysis can help guide these strategies to keep people and property safe. Analyzing your data with Risk Terrain Modeling (RTM) helps prioritize where to go and what to focus on when you get there. Identify environmental conditions that connect with crime incidents before they cluster or become persistent hot spots. Since 2009, RTM has been helping police and other city officials keep a careful eye on spatial patterns and crime trends in the here-and-now. See how new crime incidents relate to the built environment. Expose the situational contexts for crime. Interactions of people at particular places create unique opportunities for crime. RTM lets you use current data to understand current patterns, and stay ahead of crime risks before they become crime problems. At the Society for Evidence-Based Policing 2021 Virtual Conference, Thomas Abt explained how violence reduction efforts can be enhanced if the focus is taken off the guns, knives or drugs themselves, and instead placed on the illegal behaviors; that is, gun-carrying, knife-carrying and drug dealing. This can open new avenues for intervention with a focus on the illegal behavior settings. Crime hot spots are chronic illegal behavior settings 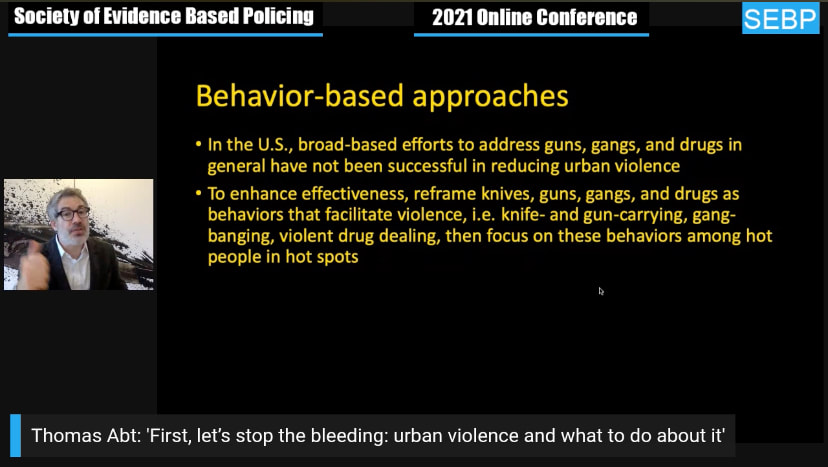 Crime hot spots are chronic illegal behavior settings. We can diagnose their attractors and generators of illegal behavior with Risk Terrain Modeling (RTM), then aim to change the ways these places influence or enable interactions of people that result in repeated crime outcomes.
But in contrast to Abt's recommendation to focus on people in hot spots, the focus of crime prevention with RTM turns to the places themselves and not directly on people at all. There’s a synergy of place-based approaches to crime prevention informed by RTM and considerations of criminal behaviors because some settings are likely attracting or promoting these behaviors more than others. This 'illegal behavior-setting' framework incorporates the role of personal preferences for crime. That is, how individual persons select and use the environments that they occupy and the impact this has on crime outcomes. It views behavioral outcomes as a function of a dynamic interaction among people that occurs at places. We can analyze why human interactions at particular places result in repeated crime outcomes. We can better understand the situational contexts for crime that routinely occur at high-crime settings. It's well known that crimes cluster and hot spots form. Hot spots are symptoms of chronically problematic places. Crimes are the outcomes of illegal behaviors. Particular features of the landscape concentrate or interact to create unique behavior settings for crime. With RTM we can diagnose environmental features that connect with crime and that create vulnerable places or persistent hot spots. Then multiple stakeholders can intervene to address the collective influences of environmental features that attract illegal behaviors as part of an approach to crime prevention. There’s compelling evidence to focus on certain types of environmental features at chronically crime-prone places. Abt's argument to consider behaviors, makes the emphasis on place even more pertinent. 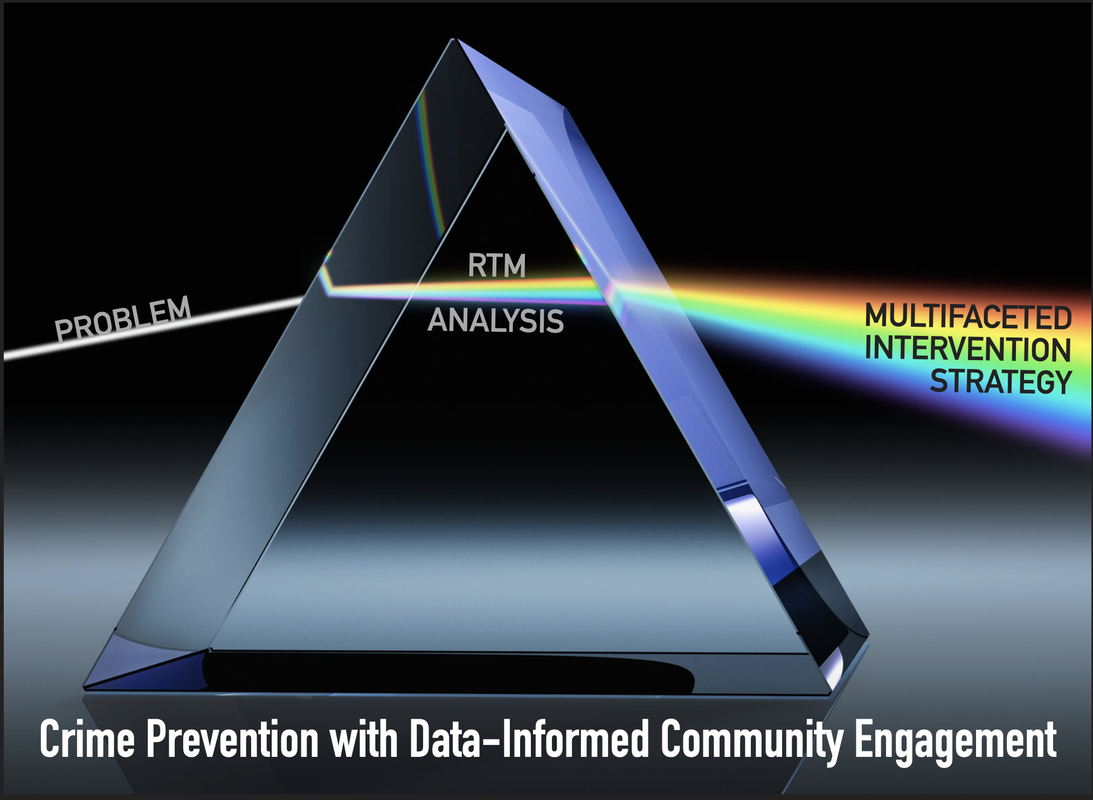 A prism serves as a good analogy for Data-Informed Community Engagement, or DICE. DICE can be a strategy for community policing and spearheaded by a police department. It can also be a city’s violence reduction plan run out of City Hall or by a community partner. The glass prism separates light into its component parts. Through the rainbow that emerges we see the full spectrum of colors and the role that each one of them plays in creating visible light. That is, we can observe visible light, but need a prism to see its component parts. With DICE, we notice an emerging or persistent crime problem, and use risk terrain modeling (RTM) analysis to diagnose its contributing factors. Then we share this information with multiple stakeholders who coordinate their own existing resources to intervene by doing what they do best at the places that need them most. While everyone’s initiatives may appear separate from one another, they combine to produce a deliberate and impactful response to crime problems throughout the city because they’re all acting on the same information to guide their plans and actions. The result is a comprehensive and sustainable crime prevention strategy, with policing just one part of the larger effort. DICE can be a strategy for community policing and spearheaded by a police department. It can also be a city’s violence reduction plan run out of City Hall or by a community partner. In his essay on the Quality Police blog, Joel Caplan discusses DICE in more detail. It introduces you to data analysis with risk terrain modeling and presents case studies that have made RTM actionable by sharing the burden of crime prevention and public safety with multiple local leaders. Related Readings (Open Access)
Over a short period of time, the COVID-19 outbreak has become a global pandemic spreading over hundreds of countries and territories around the world. In response to this unprecedented crisis, national and regional governments are implementing various strategies that seek to reduce the spread and impact of this virus. The most common measure calls for all citizens to stay at home and limit their interactions with other individuals through a process of social distancing. In an effort to reduce the stigma created by social isolation, the World Health Organization (WHO) clarified the need for physical distancing while allowing people to socialize remotely as opposed to in-person. Other restrictions have included the closing of schools and all non-essential businesses in an effort to reduce the spread of the virus by limiting opportunities for interactions among people at particular places.
In some countries, these restrictions are enforced through the use of police or the military (e.g., Spain or Italy), while others have opted for a less aggressive approach that doesn’t require police enforcement (e.g., U.S.A.). These measures have effectively altered the social fabric and routine activities of entire cities and communities around the globe. In a city like New York, the number of daily subway riders has dropped by more than 70% (according to the MTA). In densely populated world capitals where thousands of people used to congregate in any given day, streets are now mostly empty. Only grocery stores and a handful of businesses deemed by local governments to be essential remain open. The current lockdown situation has led to significant changes in the way people interact and connect with their environment. It has also led to an increase in economic uncertainty and large-scale layoffs across varying job sectors. These changes can affect the way crime opportunities are distributed across the urban, suburban and rural landscapes. Suburbanites who once routinely commuted into cities for work, for instance, are now home in the suburbs all day and night. The fundamental question then becomes whether or not a changing environment can have a significant effect on the way crime is distributed. In the city of Newark, New Jersey, recent crime statistics show that overall crime is down by 25%, with 41% fewer violent crime incidents and a 9% decrease in property crime (according to NPD data). A similar pattern seems to follow in other cities like New York, Los Angeles, or Chicago. However, it is yet unknown whether crime will continue to go down in the next weeks and months. And, most importantly, whether future crimes will emerge at past hotspots or if new ones will emerge. As cities change due to people’s altered routines and customs, one can expect that new crime patterns will emerge at new places. New hotspots will not be in the same areas as past hotspots. The spatio-temporal dynamics of crime are closely intertwined with the built environment where people’s activities take place. As these places change, offenders will likely find new opportunities at non-traditional places for criminal activity. In the coming weeks and months, law enforcement and other local stakeholders will need to be prepared to adapt to the new situational contexts for crime created by the COVID-19 outbreak. The current situation calls for data-informed approaches that can be used to chart these changes and help community groups and public agencies make decisions about how to channel resources to enhance community safety before new crime hotspots emerge or persist. These changes do not have to be noticed by surprise. Implementing better analytics and data are important steps in making emergent problems visible before they’re chronic, especially when they focus on the physical characteristics of incident locations. Being aware of emerging threats and new patterns of behavior is an essential component of public safety and community well-being (e.g., https://newarkcollaborative.org). It is therefore fundamental to expand the analytical capacities of decision-making agencies during these challenging times. Efforts will not only need to be data-informed but also require collaboration and coordination across multiple public and private agencies and nongovernmental organizations (here's a quick guide from Rutgers University). A multi-stakeholder data-informed effort allows for priority resource allocations to the people and places that need them most while quickly adapting to the continuously evolving situational contexts created by the current health crisis. Today, more than ever, data-informed community engagement programs are needed to address this global health crisis at the local level. The COVID-19 pandemic and response measures, such as school and work closures, has altered the routine activities of many people. It has also created new high demands for retail goods that are sold-out or in short supply at particular types of businesses. This creates new and uncommon interactions among people at places that could result in different opportunities for crime than what cities/towns are used to from past experience. The Modus Operandi and situational contexts of crime are likely to change too as a result.
Some types of crimes are probably more likely to increase, or decrease, compared to others. Whether police calls-for-service and/or crime rates ultimately increase or decrease is still to be systematically studied. Regardless of the frequency of crime incidents, the current pandemic situation is likely to alter the spatial and temporal patterns of crime. Hotspots of last month, or this time last year, are not likely to be the same as, nor predictive of, current crime locations. Under normal circumstances, hotspot maps can be predictive and actionable for interventions when crimes and their situational contexts remain stable. But, things are different now -- with routine activities, opportunities, situational contexts, and places of crime changing drastically from historical observations and experiences. Minimizing uncertainty in the face of emerging or persistent crime patterns provides an effective response to these challenges. Diagnosing emerging crime trends, as well as existing persistent hotspots, helps to minimize uncertainty about observed outcomes. For instance, whereas the environmental backcloth for robberies in the recent past might have related to well-known attractors/generators, emerging patterns may differ because they connect to different environmental features that are more relevant to the contemporary situational contexts of crimes (or opportunities for offending). The Rutgers Center on Public Security (at Rutgers University) has made risk terrain modeling (RTM) easily accessible through the RTMDx software to conduct analyses that diagnose environmental conditions for crime. This diagnosis produces actionable information to help police and other community stakeholders understand emerging problems and respond in ways that “flatten the curve” of crime trends before they get out of control. RTMDx is available for free to any public safety agency that wants to use it for actionable intel during these uncommon times. Go to www.rtmdx.gratis for access. |
 RSS Feed
|
|
The official website of Risk Terrain Modeling (RTM) research and resources, based out of Rutgers, The State University of New Jersey.
|