
Risk-based policing with RTM follows 3 basic steps: Assess spatial risks, deploy resources to high risk places, and collect data to check for success, then repeat. Use this worksheet as a guide. 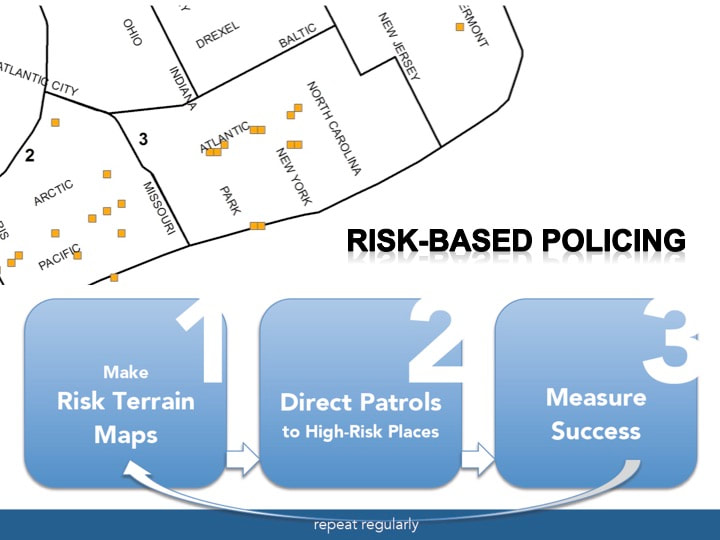 From the book Risk-Based Policing: Evidence-Based Crime Prevention with Big Data and Spatial Analytics (2018 University of California Press)
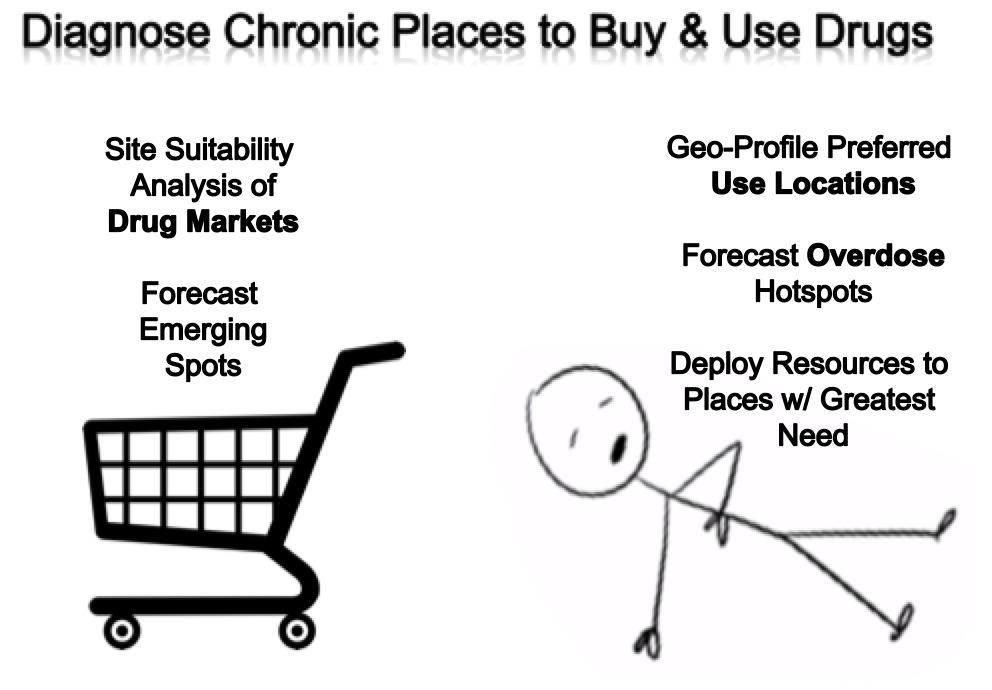 Risk Terrain Modeling (RTM) analyzes illicit drug trafficking, sales and use. RTM diagnoses seller and buyer preferences for drug markets and forecasts alternative spots or emerging settings for displacement or expansion of this behavior. RTM has been used in the United States to profile how the physical landscape affects drug dealing (of many kinds of drugs). Open-air dealing, in particular, is a complex endeavor between buyers and sellers who are frequently strangers or only loosely acquainted. Yet they must find a way to balance a competing set of demands: access and security. In the Chicago study, drug dealers and buyers took advantage of several features of the environment to establish ideal opportunities this transaction. Different types of drugs had different ideal settings, or markets, based on specific environmental qualities. These findings inform place-based policies and intervention strategies (including policing) aimed at disrupting drug markets. RTM has also been used to analyze and intervene at drug use locations, to forecast overdose 'hot spots', and to preemptively deploy resources to these places that are in the greatest need of intervention. Some public health oriented interventions have been to strategically deploy Narcan to city officials or business owners working in certain areas -- to enable overdose treatments quickly, and save lives; to place more sharps containers in public spaces -- to minimize littering of used syringes and accidental exposures to residents, visitors and public employees; to locate 9-1-1 call boxes (e.g., emergency cell phones) -- to enable reporting of overdoses or other emergencies; and to optimize advertising and recruitment campaigns for drug treatment and supportive services. Students at the University of Pennsylvania produced a spatial risk model of opioid overdose events for the City of Providence, Rhode Island by examining overdose locations in relation to environmental risk factors, community protective resources, and neighborhood characteristics to offer an assessment of areas in the city where local stakeholders can strategically allocate resources to achieve the greatest impact. The Providence Safe Stations program or the Providence Healthy Communities Office can use forecasted high-risk places for overdose as a site suitability analysis or to improve outreach and communication efforts. ...because drug dealers seek strategic locations and conditions were profit margins are maximized, the risk terrains depicting these places serve as excellent place-based forecasts. In Bogota, policies and hotspot policing practices intended to suppress illicit drug markets have resulted in sale locations becoming more dispersed. This has made monitoring and intervention even more difficult for local authorities. But new efforts at monitoring the markets of three illicit substances (cocaine, marijuana and basuco) provides valuable insights for disrupting emerging trends. Escudero and Ramírez found *drug prices* to be closely tied to certain environmental variables. And, because drug dealers seek strategic locations and conditions were profit margins are maximized, the risk terrains depicting these places serve as excellent place-based forecasts. RTM also offers actionable intel for effectively disrupting the situational contexts of these settings.
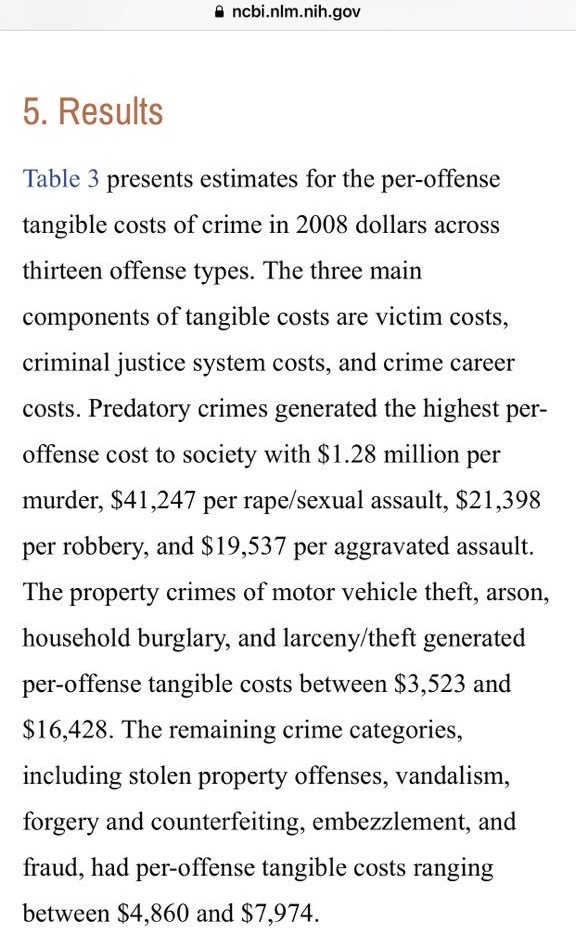
The Ideas for Peace Foundation used RTM to study microtrafficking of drugs in 5 Colombian cities (PDF reports from the Colombian Ministry of Justice): Bogota, Pasto, Medellin, Cali and Barranquilla Environmental features can influence drug sales and use behaviors, and aggravate risks of chronic drug markets at particular places. RTM can help to diagnose these environmental vulnerabilities and identify places that are most in need of resources and risk reduction strategies. Crime reductions are important to police agencies and the communities they serve for many reasons. One reason is that less crime saves money. The National Institutes of Health (NIH) estimated that preventing just 6 violent crimes could save local criminal justice systems $100,000 and free up more than 9 hours of a police officer's patrol time. Recent surveys show that 2/3 of gunshot victims are uninsured, yet the average nationwide cost of treating gunshot wounds in hospital is $21,000 per person. Just 10 fewer shootings could result in over $200,000 worth of hospital cost savings, and, of course, 10 lives possibly saved.
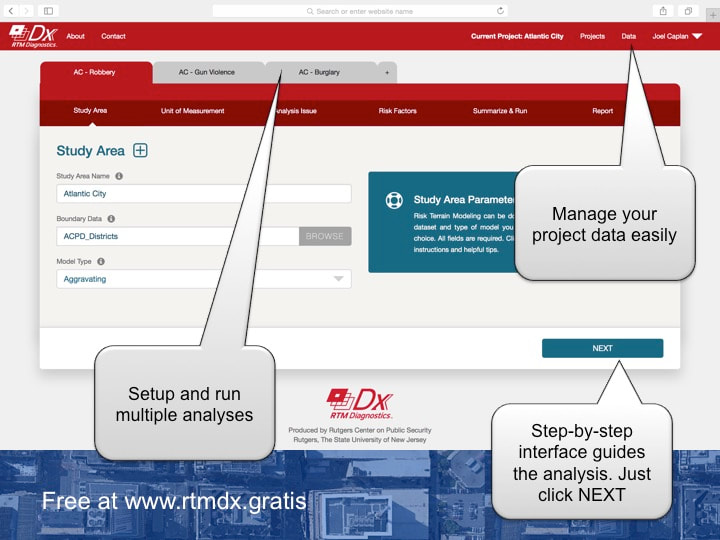
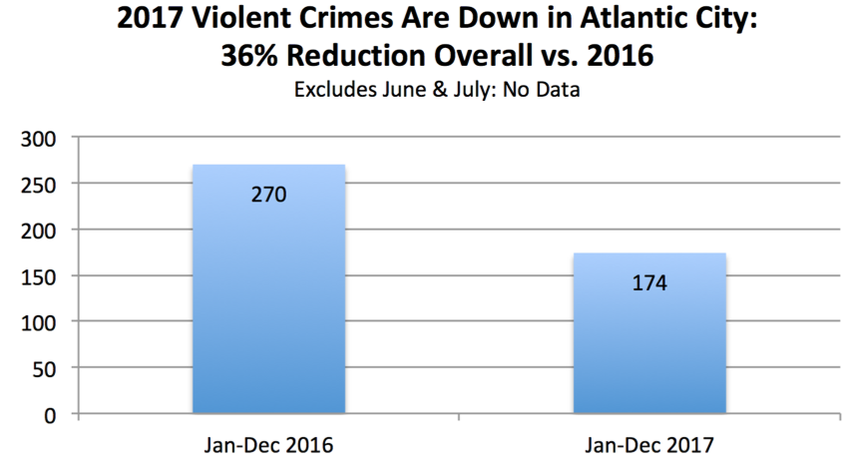
Risk Terrain Modeling (RTM) is crime analysis that helps answer where and why crime happens. It finds important spatial patterns in your data and then it uses this diagnosis to make accurate and actionable predictions. Policing with RTM makes every dollar spent on public safety more effective. It's smart policing. RTM is one reason given for Atlantic City's crime drop last year. The Atlantic City Police Department (ACPD) fully implemented risk-based policing with RTM in 2017, and they succeeded in achieving month-to-month crime reductions and higher case clearance rates, all while improving community relations. They were credited with a 36% reduction in violent crimes by the end of the year. This represents a potential cost savings to the local criminal justice system of over $1.6 million.
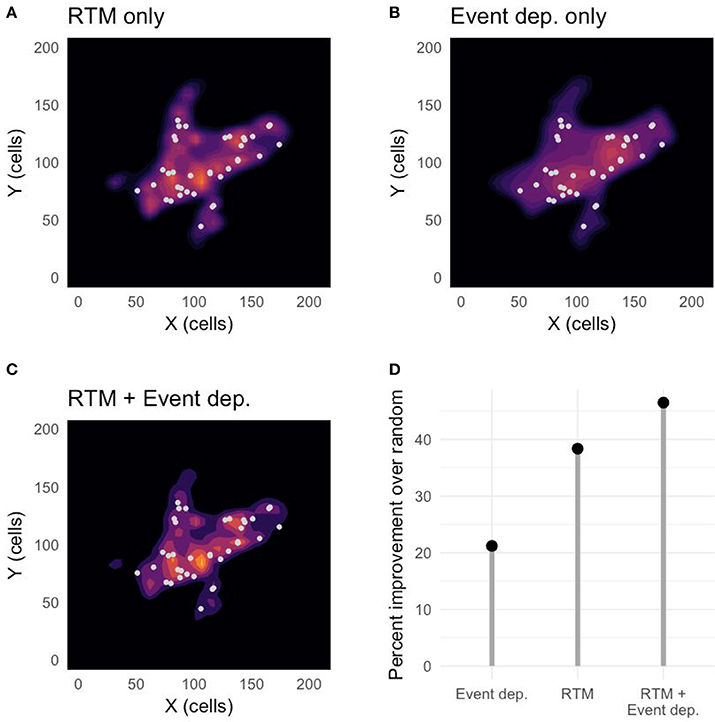
The new article, "Predicting Dynamical Crime Distribution from Environmental and Social Influences", published in Frontiers in Applied Mathematics and Statistics finds that combining risk from exposure (past events) and vulnerability (environment) when modeling crime distribution can improve crime suppression and prevention efforts by providing more accurate forecasting of the most likely locations of criminal events. As shown in the graphic below, Risk Terrain Modeling (RTM), as a measure of spatial vulnerability to crime, outperforms event-dependent methods (I.e. recent past exposures, such as hot spots or near repeats) as a predictive analytic. But, more importantly, a combined vulnerability-exposure measure outperforms both solo methods. By large margins. This would be expected according to the Theory of Risky Places. All models tested in the Frontiers article perform better than random, with the composite model performing better than the RTM-only model and the event-dependence-only model, in that order. The RTM-only prediction is roughly 70% better than the event-dependent prediction (I.e., hot spot, near repeat). And the composite model prediction is more than 100% better than the event-dependent prediction.
One take-away for researchers is that it’s important to consider the impact of the physical environment and how it influences outcomes resulting from human interactions at places. Since at least 1997 Abbott has claimed that "no social fact makes any sense abstracted from its context in social space and time…" He is correct. And, as such, requires researchers to operationalize more than just "crime counts" or "hot spot maps" as variables (or co-variates) in their statistical models. For instance, when researchers in Little Rock, AR used RTM to develop an aggregate risk of crime measure that they analyzed alongside a concentrated disadvantage index value, they produced a model that explained 55% of variation in neighborhood violent crime rates. This is no small feat considering that Weisburd and Piquero have commented that most criminal justice research does not often explain variations in crime by more than 20%. For practitioners, this reaffirms the call to go farther than merely mapping and then policing hot spots. Hot spots are just signs and symptoms of environments that are highly suitable for crime, but they offer very little insights for solutions to manage crime problems. RTM adds a spatial diagnosis. By combining Risk Terrain Modeling with hot spot analysis, you learn where to go and what to focus on when we get there. You add the why to the where. And as the research proves, interpreting crime vulnerabilities and exposures together makes the best forecasts, regardless of whether crimes persist, displace, or emerge at places where they have not happened before.
Bringing the vulnerability-exposure framework into professional practice ensure that you offer police (or other stakeholders) a unique opportunity to suppress crimes immediately by allocating resources to existing problem areas, and to initiate prevention strategies at the most vulnerable (high-risk) places within hot spots. This form of risk-based policing, whereby interventions are focused on the spatial attractors/generators of crime at priority places is discussed in detail (with lots of case studies) in this forthcoming book. Additional information and research evidence can be found at www.rtmworks.com.
So, in a nutshell: Risk Terrain Modeling is a best-practice that does not have to replace existing practices. It complements them to enhance crime analysis and to produce actionable intelligence for police commanders that want to be efficient and effective problem-solvers. 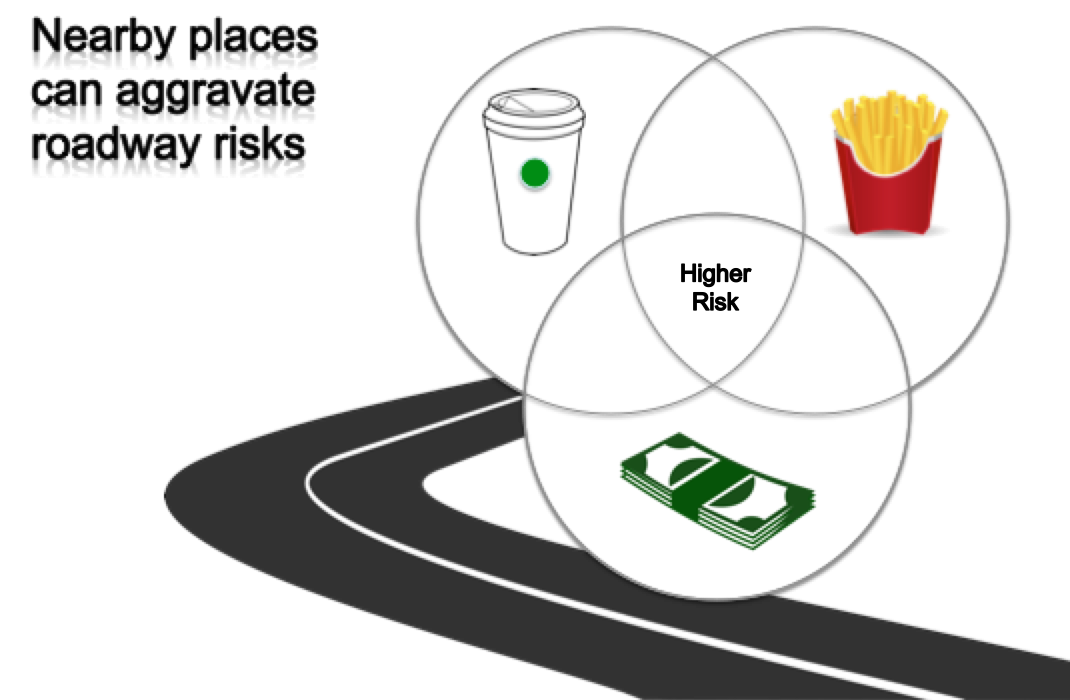 Hazardous road conditions, dangerous intersections, intoxication, fatigue or distracted driving are commonly linked to motor vehicle crashes. Geo-spatial factors can also influence driver behaviors and, therefore, increase the risks of crashes along certain sections of roadways, particularly where these factors co-locate. For example, a risk narrative might be: drivers are anxious or in a rush to arrive at the stores to get their coffee, and then leave coffee shops or cafés or convenience stores while simultaneously pouring creamers, adding sugars, or reapplying the lids one-handed; drivers may exit bank drive-thrus while counting money or putting cash in wallets or purses; or drivers may pick at the french fries, open dipping sauces, or attempt to eat full meals upon exiting fast food takeout restaurants. These and other environmental features can influence driver behaviors and aggravate roadway risks at places nearby where they interact. Risk Terrain Modeling can help to diagnose these environmental hazards and identify roadways that are most vulnerable. Then use professional judgement, expertise, and evidence-based practices to solve these problems through risk reduction strategies. This 2018 research study showed that RTM can also fit within a DDACTS framework to provide law enforcement with guidance for identifying places where vehicle crashes are likely to occur in the future. RTM's focus on where and why provides insights for multi-stakeholder partnerships capable of preventing traffic crashes and related injuries. How do police know it’s what they did that made the difference? This is a great question, and frequently asked by crime analysts learning about Risk Terrain Modeling (RTM). One way to determine the impact of law enforcement and policing actions at high-risk places is to decide on the response strategy in advance of implementation, intentionally focusing policing actions on one (or more) of the risk factors. Specifically state this intent from the get-go. The factors that could be focused on will be identified by the risk terrain model. Then compare new risk terrain models to the older ones. For example, if "convenience stores" were a top risk factor for motor vehicle thefts, a risk reduction strategy might be to increase patrols around convenience stores located in high-risk areas; to put sign-in sheets in the stores for officers to engage more with the managers while showing a police presence; or to display informational posters on store windows reminding customers: "Turn off car. Take keys. Lock doors. Prevent theft." There are more and probably better examples than this. But hopefully you get the idea. Then, after deploying that risk reduction strategy for a period of time (e.g., 1 month), run a new risk terrain model and compare the Relative Risk Value (RRV) of the before-and-after results for the targeted risk factor. If the factor that you intentionally focused on has a lower RRV after the intervention compared to what it had before your intervention activities, then you may have had an effect. If crime also went down during the intervention time period, then you may have prevented crimes by mitigating the risk factor. Both of these things -- risk reduction and crime prevention -- could be credited to the police activities. If the risk factor (e.g., convenience stores) was present in the risk terrain model before the intervention and wasn't present in the model after the intervention, then that could mean you completely mitigated the risk factor's spatial influence based on your actions. It's no longer a crime attractor/generator. Now you can deal with any new crime dynamics that exist, which you know well based on the newly updated risk terrain model that serves as your next month's forecast and intel for risk reduction strategies and deployments. 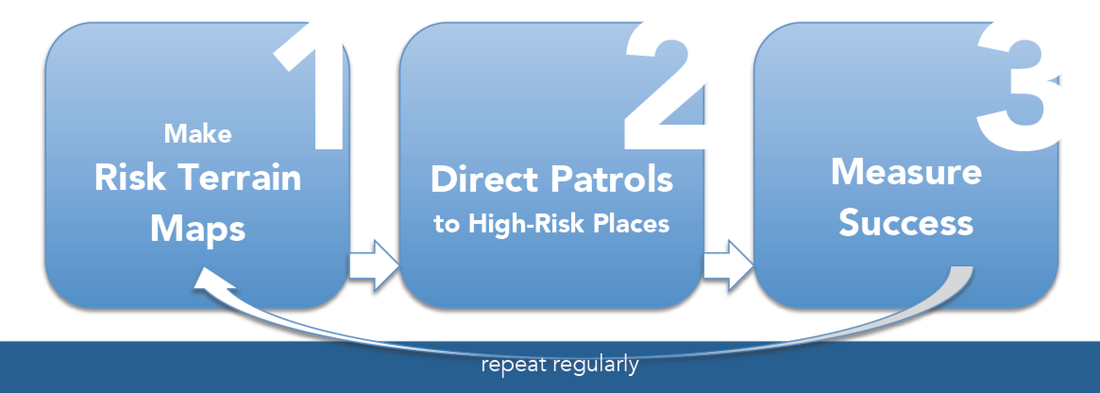
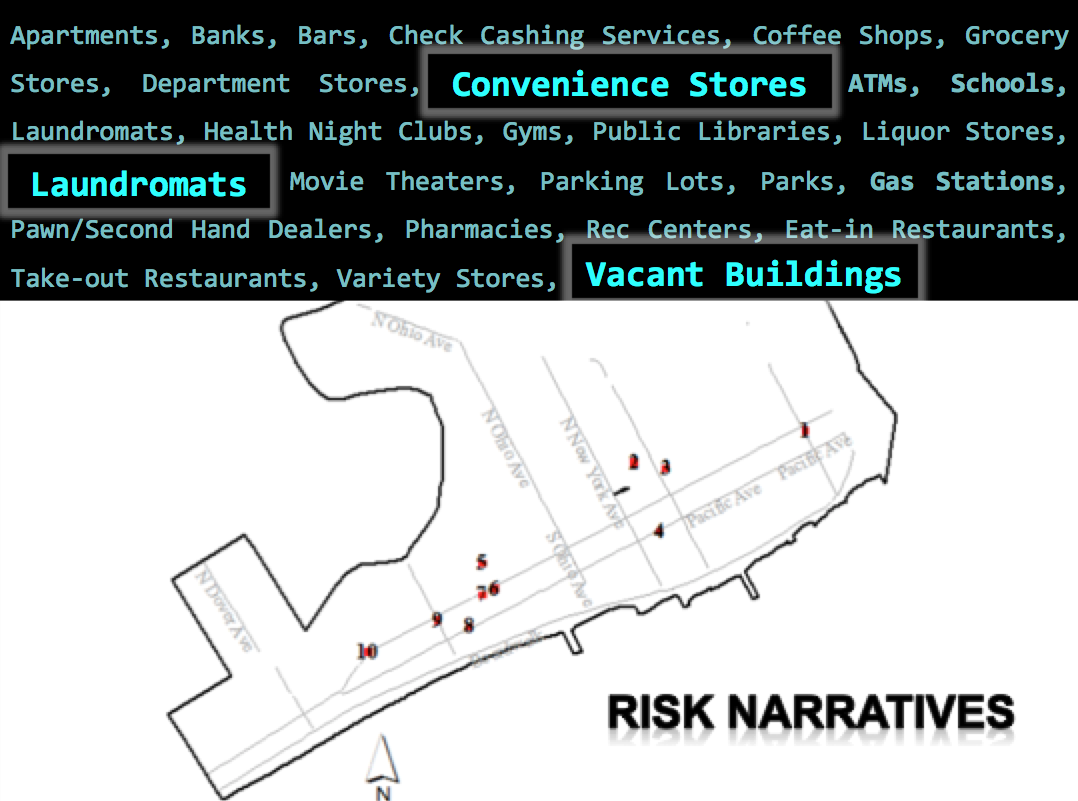
Develop Spatial Risk Narratives. A risk narrative is a spoken or written account of how events, such as crimes, relate to other phenomena in the jurisdiction. Crime events occur within spatial and situational contexts. So, assessing the crime risk narrative is an endeavor for police and other stakeholders to think spatially about criminal events and behaviors.
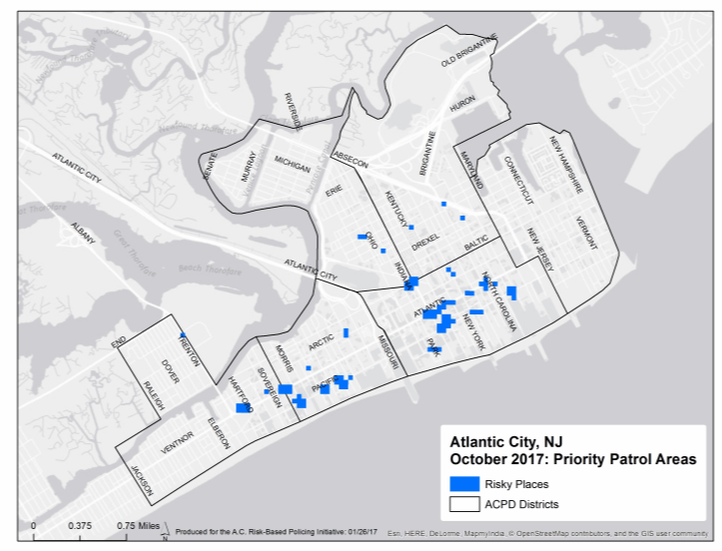
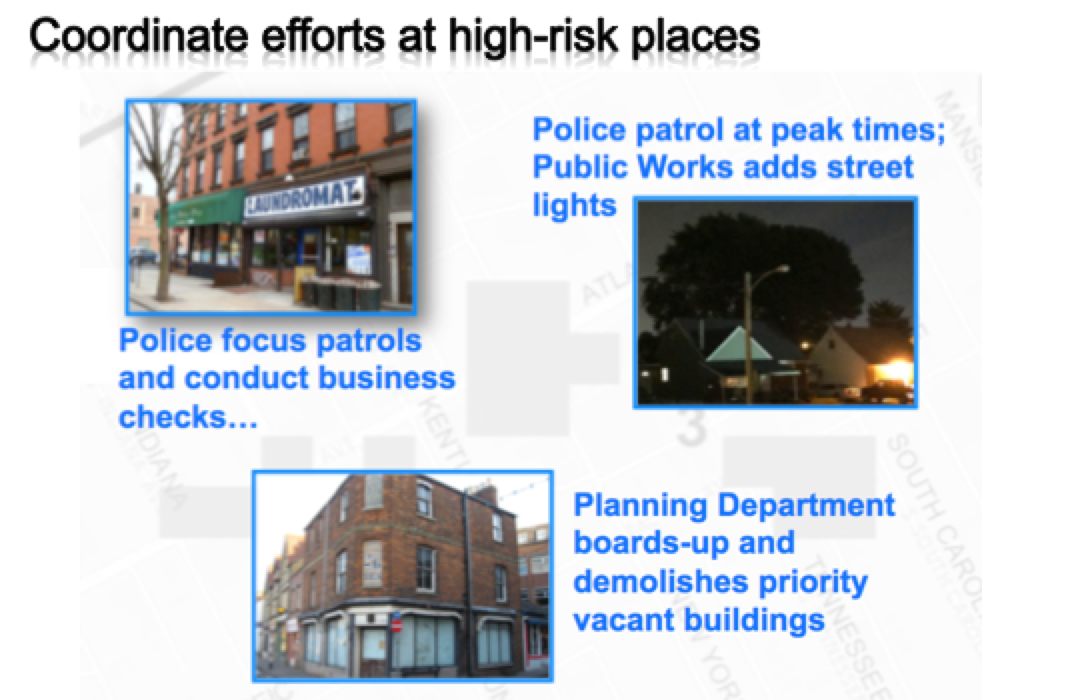
In Atlantic City, NJ, risk narratives were formed from the results of Risk Terrain Modeling (RTM): police and other stakeholders believed shootings to be connected to drug sales and related turf conflicts whereby ‘convenience stores’ are the places where drug buyers are solicited; Nearby ‘laundromats’ are locations where drug transactions are made; ‘vacant buildings’ located nearby are used by drug dealers as stash houses for drugs and weapons, or by drug buyers to use drugs after purchase. These three environmental features were top risk factors identified by RTM. [Atlantic City is discussed in the forthcoming book "Risk-Based Policing: Evidence-Based Crime Prevention with Big Data and Spatial Analytics" (2018, Univ. of CA Press) and was spotlighted on the National Geographic Channel in 2017.] When community stakeholders used the data driven evidence to surmise that drugs, prostitution, retail businesses, and vacant properties are related in this way to shootings, they were more likely to agree with police that certain places will probably experience shooting incidents in the future. This led to conversations about how to effectively target and remediate the problems in these locations. That is, to disrupt the narrative. Policing interventions reduced shooting events by focusing preemptively on the risky places. Areas around laundromats received directed police patrols; police officer ‘meet-and-greets’ with convenience store managers were implemented at frequent intervals each day; and the city’s Planning and Development department prioritized remediation of vacant properties and installations of new LED street lights (to replace dimmer halogen lamps) at the highest risk places. Risk narratives aid police in articulating crime problems in diverse ways, beyond those entailed in established paradigms, practices, or procedures. Risk narratives support reasoning with hypotheses, whereby preconceived notions about a crime problem and its relationships to space and time are tested and addressed accordingly. Risk terrain modeling informs and advances risk narratives. Risk narratives enable effective risk governance led by police and supported by other city officials. Crime is dynamic, and a function of the interaction of people at places. You may already know where crimes are happening in your city. RTM helps to identify why these places are chronic problems. You bring meaning and context to the analytical results via risk narratives. This allows policing operations to be enhanced, not replaced, by technology. From Risk Terrain Modeling and risk narratives about spatial and situational contexts of crime, strategies for police are developed that focus on risk reduction in order to prevent crimes. 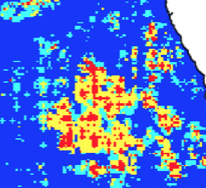 According to the Theory of Risky Places (TRP), risk levels of crime could and should be computed at places according to the interaction effects of known locational features. Risky places are particular portions of space that have been assessed for their likelihood of experiencing crimes and to which a relative risk score has been attributed. According to the TRP, risky places are a product of the combined effects of vulnerabilities and exposures to crime.
Vulnerability comes from the presence of a combination of spatial influences of features of a landscape that enhance the likelihood of crime. This is articulated through Risk Terrain Modeling (RTM). Exposures refer to the historical facts and collective memories people have about places and the events that occurred there, such as knowledge about crime hot spots. A vulnerability-exposure analytical framework considers the integration of RTM and measures of exposures to crime, such as kernel density estimated hot spots. This provides a basis for analyzing the system processes of spatial influence whereby crimes emerge, persist or disappear. The combined effects of vulnerability and exposure lead to the identification of risky places. For more on this, see Chapter 5 in "Risk Terrain Modeling: Crime Prediction and Risk Reduction" by Caplan & Kennedy (2016; Univ. of CA Press).
1. The Study Area boundary shapefile
Risk terrain modeling can be applied to any geographic extent (i.e. local, regional, global; urban, suburban, rural; land, sea). Obtain a projected polygon shapefile to spatially define this geography. (e.g., the municipality of Springfield). Essentially, shapefiles are your reference layers for orienting and analyzing all other data. Most study area shapefiles are free and readily accessible online. This blog post shows how you can easily get study area shapefiles for anywhere in the United States from the U.S. Census Bureau. 2. Topic/Analysis issue data Risk Terrain Modeling can be used to analyze almost any topic. The topic data represents the problem or issue that you will analyze (e.g., incident locations of robberies, traffic crashes, or drug overdoses). Obtain datasets for a topic of your choice. Use data that is representative of the entire study area and that contains location information. The data file must be in the format of a shapefile (.shp), KML/KMZ file, or comma delineated (.csv) file with XY coordinates. This blog post hows how to easily geocode your own data tables into KML/KMZ files. 3. Risk factor data These data represent environmental features of the study area, such as grocery stores, gas stations, or schools. A list of "Risk Factor Suggestions" can be found here. Use data that is representative of the entire study area. All datasets of factors that may spatially connect to the topic/analysis issue should be compiled and inputted for testing with RTM. Do a basic review of published reports and consult professional practitioner experiences to identify possible risk factors and then obtain related datasets. For each risk factor, the data file must be in the format of a shapefile (.shp), KML/KMZ file, or comma delineated (.csv) file with XY coordinates. This blog post shows how to easily get risk factors directly from Google Earth. The RTMDx software accepts data in three formats:
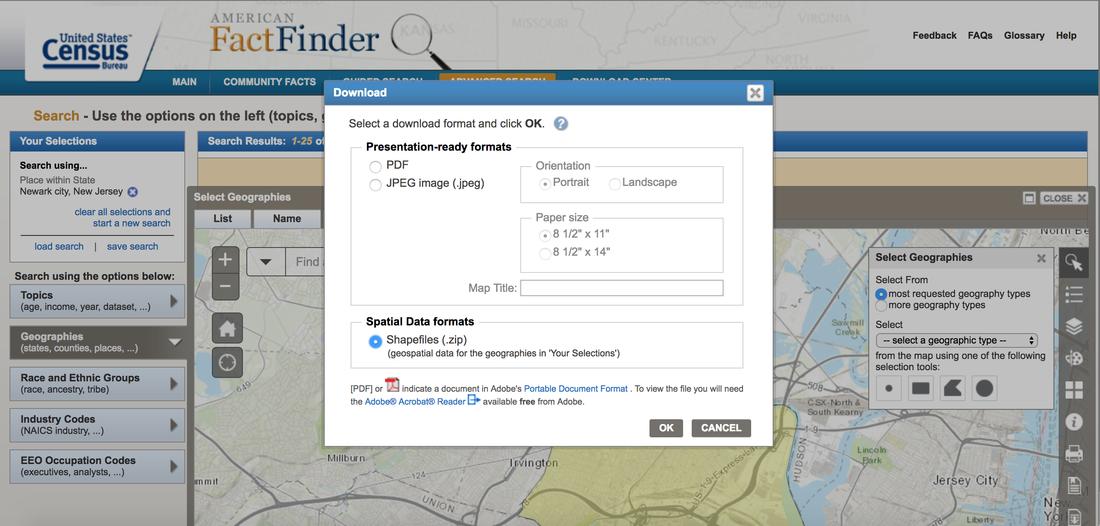
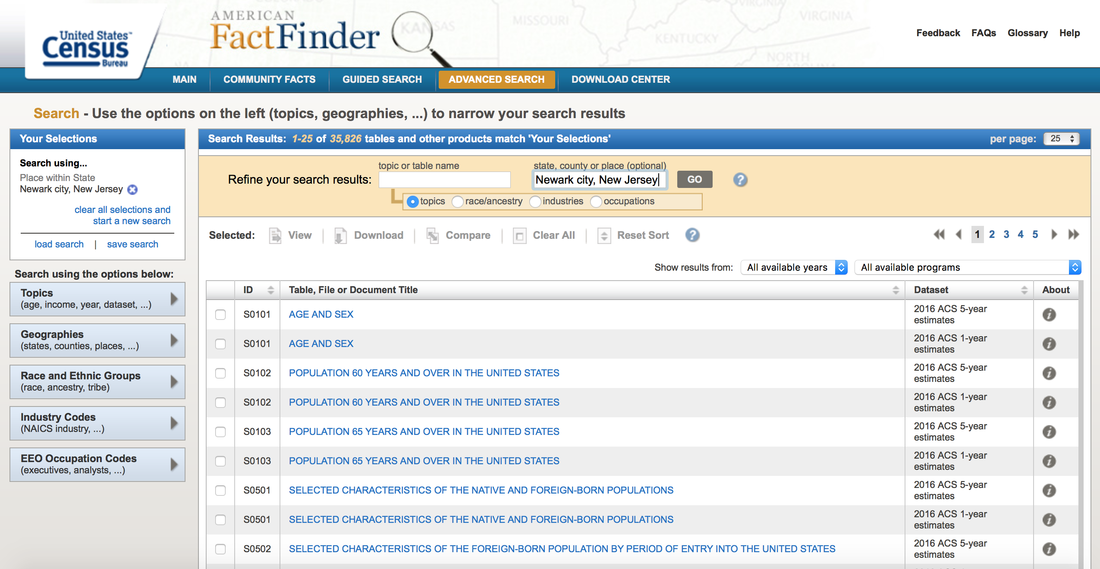
RTMDx can filter your data by date, time or other attribute values. So, consider including variables in your datasets that will enable you to delve deeper into analyzing spatial risks based on subsets of these data. For example, a burglary dataset may have a variable distinguishing "residential", "commercial" and "motor vehicle" burglaries. Traffic crash datasets may note "pedestrian" incidents or "DWI/DUI" incidents. Robbery incidents that occur at certain "times" of the day or "date" ranges could be analyzed separately from all other incidents. Prepare your data to make it as useful as possible for analyzing in meaningful ways. Downloading geographic boundary shapefiles from the U.S. Census Bureau is straightforward. Here's how to do it for any location in the United States. This is also a simple way to get "study area" shapefiles for Risk Terrain Modeling (RTM). 1. Open American FactFinder (http://factfinder.census.gov) 2. Click on "Advanced Search" (menu options at the top of the screen) 3. Search for a geography in the "state, county, or place" text box (E.g. Newark city, New Jersey)
4. Click on "Geographies" tab on the left side of the webpage, then click on the "Maps" tab 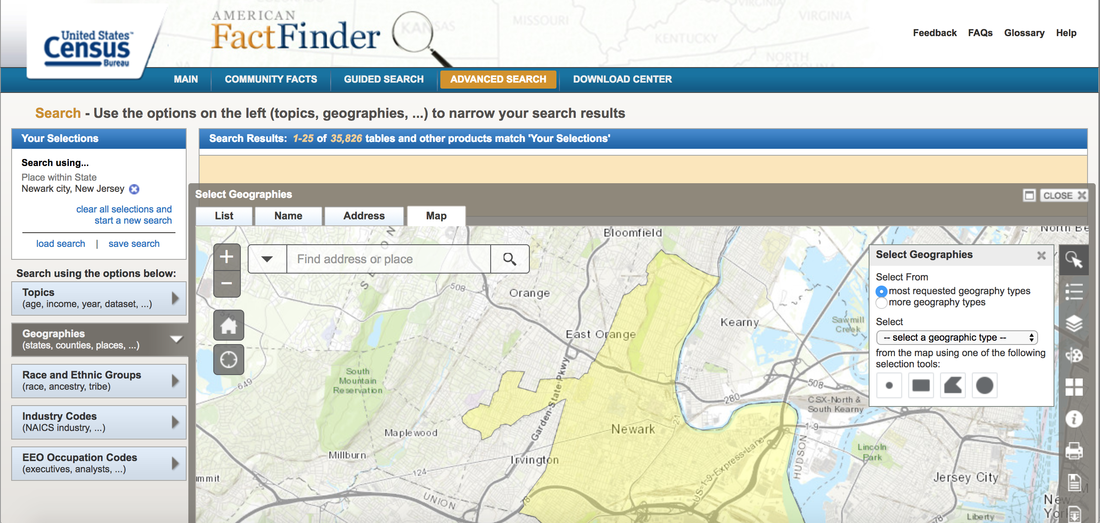
 Video Tutorial for Downloading Boundary Shapefiles |


 RSS Feed
|
|
The official website of Risk Terrain Modeling (RTM) research and resources, based out of Rutgers, The State University of New Jersey.
|